Press and data findings
Five findings from the Plugging Index data, each with a chart, the exact figures, a method note and a citation line. Data through 2026-06-30. Charts may be used with the citation line.
Press contact: [email protected] (Plugging Index Research)
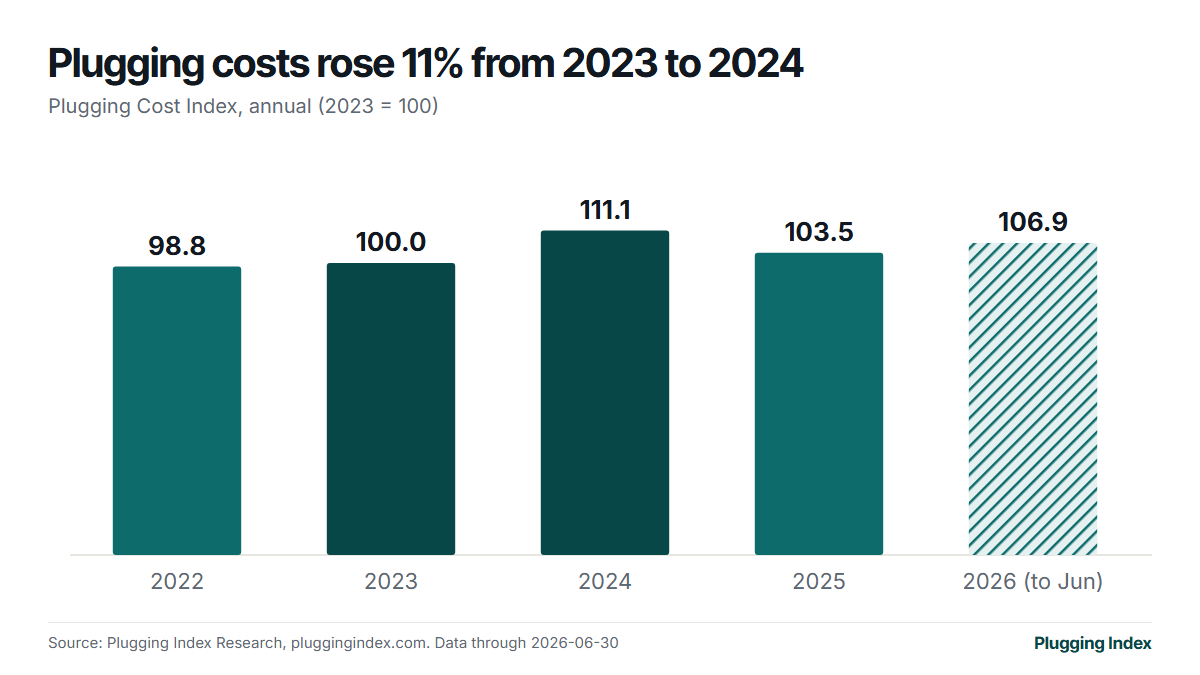
1. The cost of plugging wells rose 11% from 2023 to 2024, then eased in 2025.
Exact figures
- Plugging Cost Index, annual (2023 = 100): 2022 98.8, 2023 100.0, 2024 111.1, 2025 103.5, 2026 to June 106.9.
- Change 2023 to 2024: +11.1%. Wells behind the 2023 and 2024 values: 6,428 and 2,408.
- Both years are rated high confidence: the index level differed from the held-out check by about 2.4% (2023) and 1.7% (2024) on wells left out of the calculation.
Method note. A like-for-like index: it compares the cost of plugging wells in the same state, of the same type and depth band, across years, so a change in which states report does not move it. 2026 is part-year (to June).
Cite as: Plugging Index Research, Plugging Cost Index, annual, data through 2026-06-30. https://pluggingindex.com/cost-index/
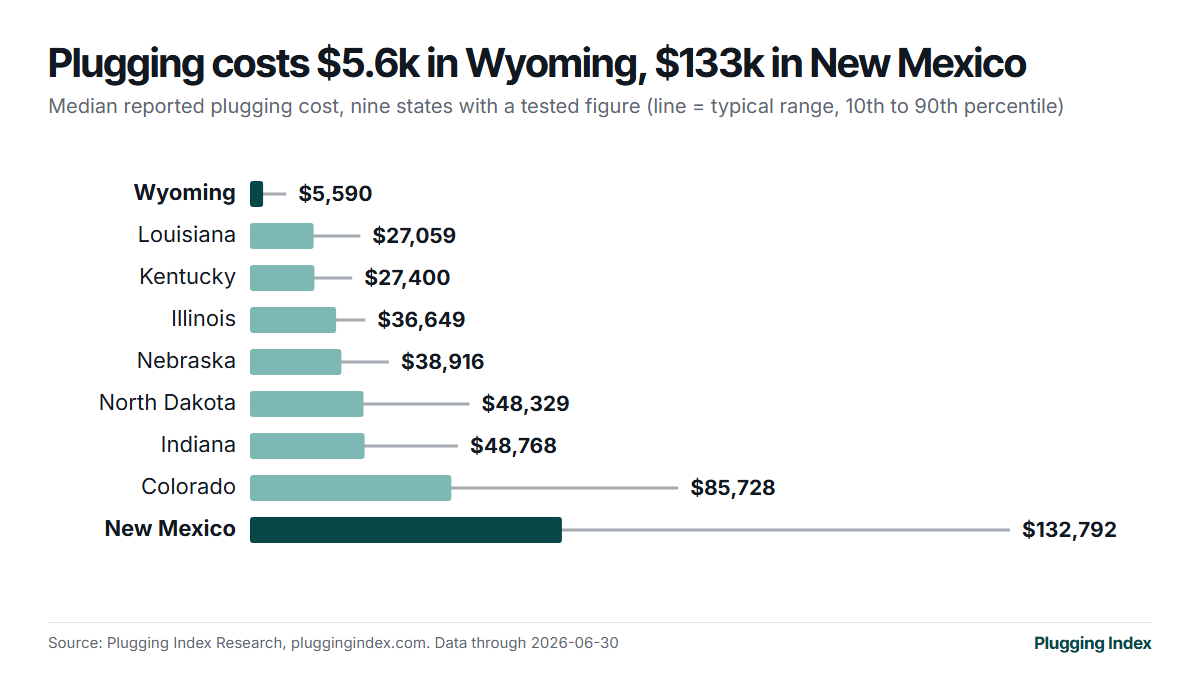
2. The typical cost to plug a well ranges from $5.6k in Wyoming to $133k in New Mexico, about 24 times as much.
Exact figures
- Wyoming median $5,590 (typical range $5,051 to $15,448; 480 independent observations, high confidence).
- New Mexico median $132,792 (typical range $74,508 to $323,520; 217 independent observations, moderate confidence).
- The other seven graded states have medians from $27,059 to $85,728.
Method note. Medians of costs reported to the US Department of the Interior for publicly funded plugging of orphaned wells. Only states whose figure passed testing on wells left out of the calculation are shown (9 of 25). The gap reflects the wells and programmes in each state's records; it is not a ranking of states.
Cite as: Plugging Index Research, State medians for plugging orphaned oil and gas wells, data through 2026-06-30. https://pluggingindex.com/states/
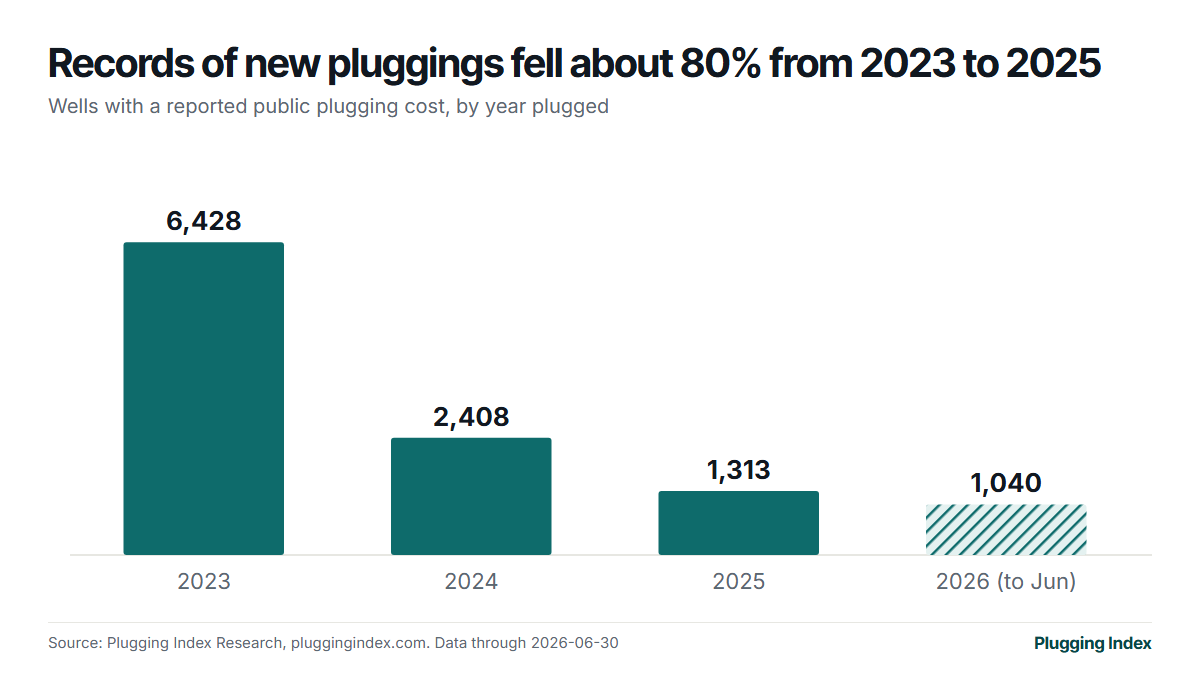
3. Public records of newly plugged wells fell about 80% from 2023 to 2025.
Exact figures
- Wells with a reported plugging cost, by year plugged: 2023 6,428; 2024 2,408; 2025 1,313; 2026 to June 1,040.
- Change 2023 to 2024: -63%. Change 2023 to 2025: -80%.
- The quarterly count bottomed at 158 wells in 2025Q1 and has recovered to about 500 a quarter in 2025Q4 and 2026Q1-Q2.
Method note. Counts of cost records in the Department of the Interior orphaned wells layer (11,741 records, 25 states) by the date the well was plugged. Recent quarters can be revised upward as agencies report late. 2026 is part-year.
Cite as: Plugging Index Research, Records of publicly funded well plugging by year, data through 2026-06-30. https://pluggingindex.com/cost-index/
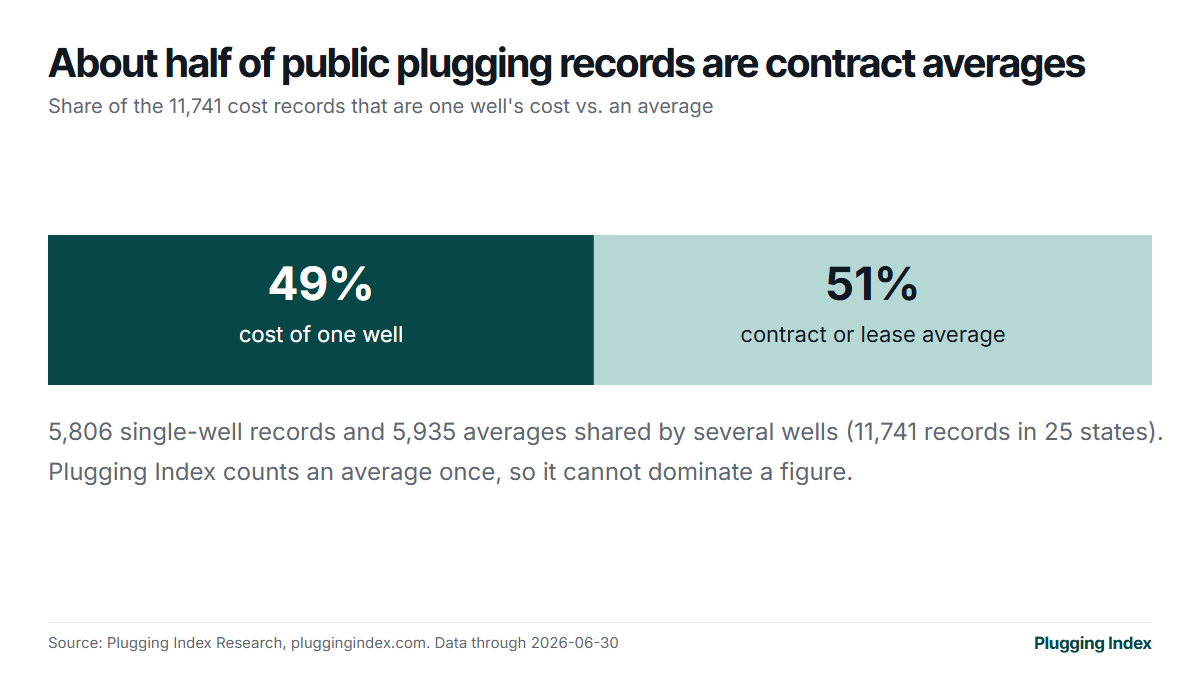
4. About half of public plugging cost records (51%) are contract averages, not the cost of one well.
Exact figures
- 11,741 records in total; 5,806 (49.5%) are a cost for a single well; 5,935 (50.5%) are a contract or lease average shared by several wells.
- Where a contract average is shared by several wells, Plugging Index counts it once when testing and building the index.
Method note. A record is treated as a contract average when three or more wells of one recipient carry an identical cost. Averages hide the spread between wells, so ranges for states dominated by averages understate real variation.
Cite as: Plugging Index Research, Share of single-well and contract-average cost records, data through 2026-06-30. https://pluggingindex.com/about/#limitations
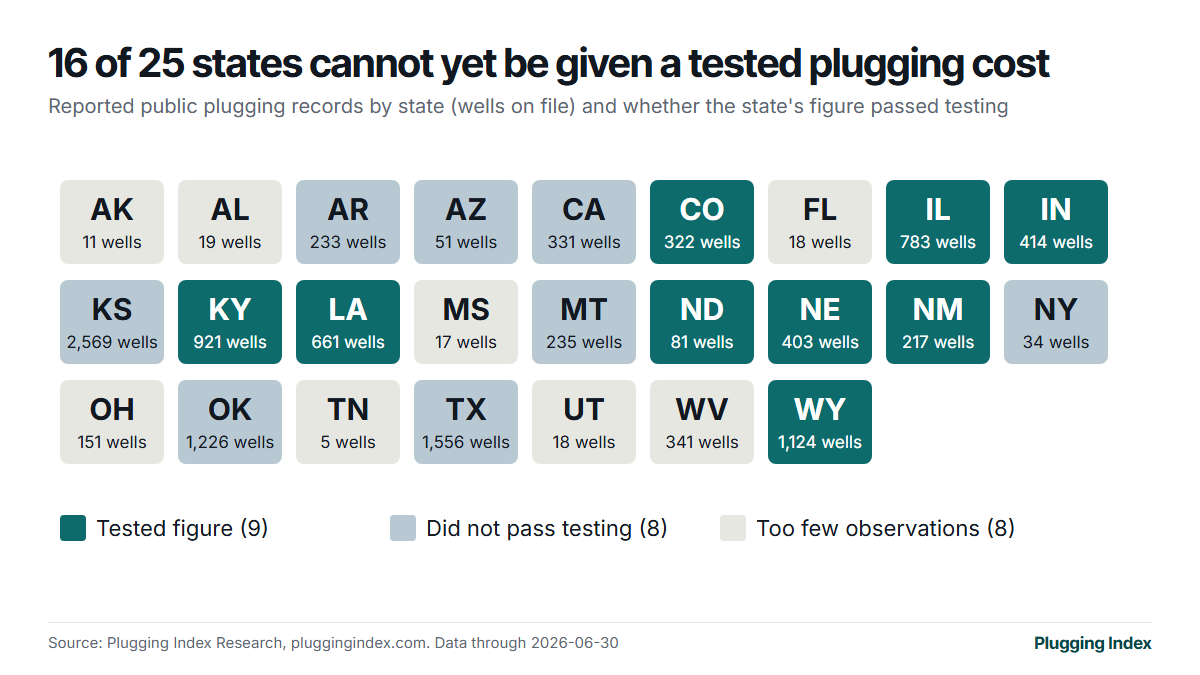
5. 16 of 25 states cannot yet be given a tested plugging cost, including Texas, Oklahoma and Kansas.
Exact figures
- Graded (passed testing): 9 states: CO, IL, IN, KY, LA, ND, NE, NM, WY.
- Too few independent observations: 8 states: AK, AL, FL, MS, OH, TN, UT, WV.
- Records on file but the figure did not pass testing (typical miss above 40%, or too few independent observations): 8 states: AR, AZ, CA, KS, MT, NY, OK, TX.
- Texas, Oklahoma and Kansas together hold 5,351 of the 11,741 records (46%).
Method note. A state figure is published only if it passes held-out testing: high confidence needs 200 or more independent observations and a typical miss within 25%; moderate needs 60 or more and within 40%. Thresholds are never relaxed to make a figure pass.
Cite as: Plugging Index Research, Which states have a tested plugging cost, data through 2026-06-30. https://pluggingindex.com/states/
About the data
Plugging Index estimates what it costs to plug oil and gas wells from 11,741 costs reported to the US Department of the Interior's Orphaned Wells Program Office for wells plugged with public money since late 2022, in 25 states. A figure is published only if it passes testing on wells left out of the calculation: high confidence means it typically misses by no more than 25%, moderate confidence 40%. Figures that do not pass are shown as "Insufficient data".
The records are mostly old, shallow orphan wells plugged under public contracts. The figures are benchmarks, not quotes, and do not describe deep, horizontal or offshore wells. Full method and limits: methodology and limitations. Free data downloads: Data and API.
Every figure on this page is checked against the current data each time the site is built.